
The short answer
Open the image-to-table tool, add one clear picture of a table, press Convert table with AI (1 trial), compare the editable grid against your original, then download CSV or XLSX. In our three test runs (a crisp screenshot, a tilted low-resolution photo of a Chinese price list, and a table with merged cells and blank cells), every number, date, minus sign, leading zero and empty cell came back exactly as shown in the image — 81 of 81 body values correct — and in these runs the tool left unreadable cells empty with a note rather than guessing. The part people get burned by is not the extraction: it is the XLSX export silently turning 007 into 7. Read the export section below before you trust any converted file.
What the tool does — and what it doesn't
The tool sends your image through YYSI's server to an AI model (DeepSeek) that returns a structured grid. The grid appears next to your original image; you can edit any cell inline, and the download contains exactly what you finally see — your edits included. Cells the model is unsure about are supposed to be highlighted yellow and left blank for you to fill; in our three samples no blank came back filled with an invented value — a design goal plus a small-sample observation, not a product guarantee, so check cell by cell. It does not read multi-page documents (one image per task), does not keep your image (it is not stored), and caps tables at 30 columns and 60 rows — bigger tables come back truncated with a note.
Steps in the tool
- Sign in. The tool needs a free YYSI account: every account gets 3 site-wide AI trials that never reset, and this task uses 1 per run.
- Add one image. Drag a table screenshot into the drop area, click to choose a file, or paste one. JPG, PNG or WebP, up to 10 MB. Large images are downscaled to 2,000 px on the long edge in your browser before sending — our 700 px-wide test photo went up as a 30 KB JPEG re-encode.
- Run the task. Press Convert table with AI (1 trial). All three of our runs returned in roughly 10–20 seconds. The result appears as an editable grid beside your original image.
- Compare and fix. Check the grid against the picture, cell by cell where it matters (totals, dates, minus signs). Edit any cell inline; add or remove rows and columns with the toolbar buttons if the structure needs it.
- Export. Download CSV or Download XLSX — both export exactly the edited grid. Copy for spreadsheet puts a tab-separated copy on your clipboard for pasting straight into Excel or Sheets.
How we tested (rules fixed before the runs)
We drew three original synthetic tables and wrote the expected values (truth files) for each before running anything. Scoring was fixed in advance: a cell passes *verbatim* if the text matches exactly; numeric values also count as *semantically correct* when only a thousands separator differs (1,024.00 vs 1024.00); a blank cell in the image must come back blank or yellow-flagged — an invented value in a blank would be the worst error class. Runs used a standard test account (the same 3-trial policy you get), one run per sample, no retries, on 2026-11-10 in Chromium 152 / Windows 11 against the live site.
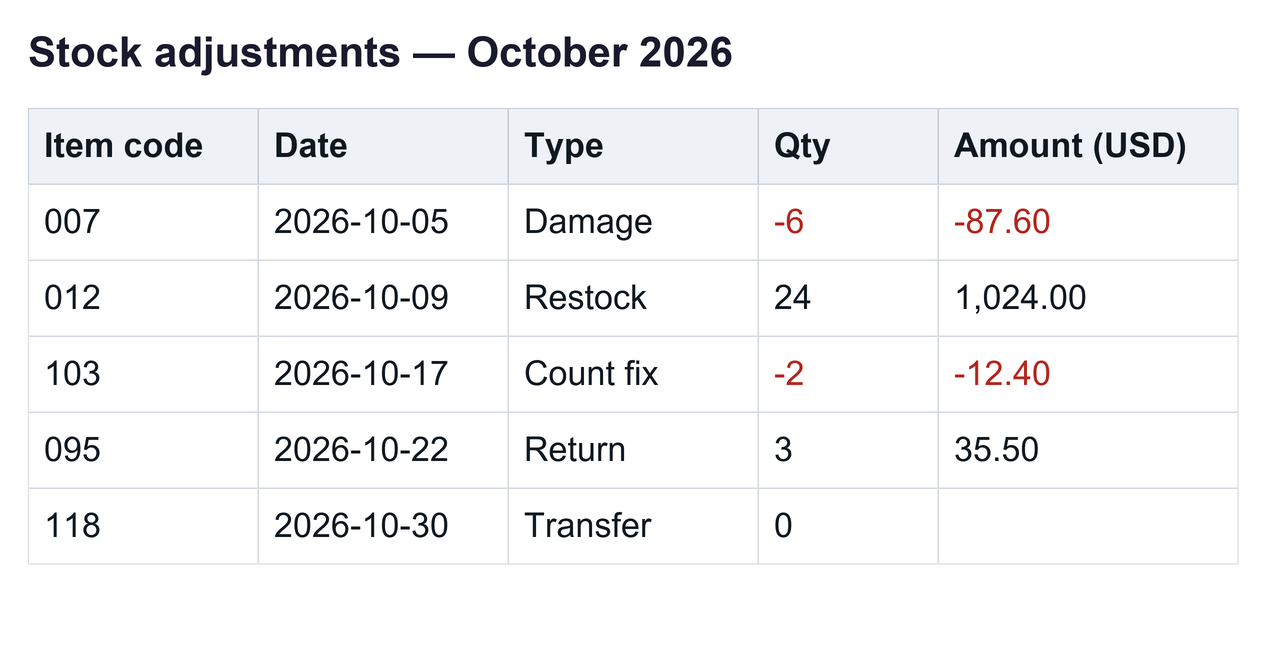
- Case A — clean screenshot: crisp English inventory-adjustments table, 5 columns × 5 rows, seeded with leading zeros (
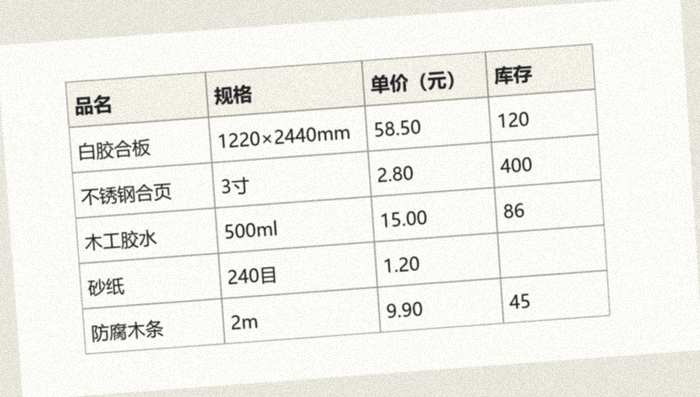
007), dates, negatives, trailing zeros (-87.60), a thousands separator (1,024.00), a zero and one blank cell. - Case B — tilted low-res photo: the same price list rendered as a printed Chinese sheet, then rotated 4°, blurred, noised, shrunk to 700 px wide and saved as quality-55 JPEG — a pessimistic phone-photo scenario, 4 columns × 5 rows with one blank stock cell.
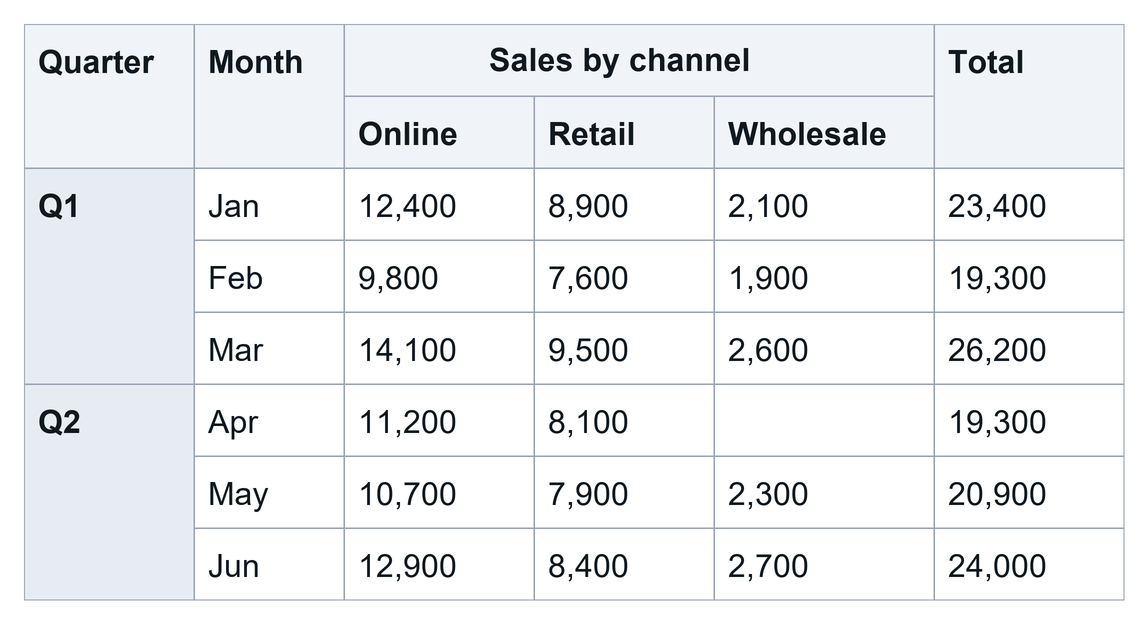
- Case C — merged cells and blanks: English quarterly summary, 6 columns × 6 rows, two-level header ("Sales by channel" spanning three columns), quarter cells merged vertically across three rows each, one blank cell, and row totals you can re-compute.
Case A — clean screenshot: exact, including the nasty bits
Everything the image showed, the grid showed: 007 kept its leading zeros, -87.60 kept its trailing zero, the date format survived untouched, and the blank Amount cell came back empty — nothing invented in this run. The thousands separator was kept as displayed (1,024.00), which our truth file records as 1024.00 — a match in value, shown verbatim as printed.
| Item code | Date | Type | Qty | Amount (USD) |
|---|---|---|---|---|
| 007 | 2026-10-05 | Damage | -6 | -87.60 |
| 012 | 2026-10-09 | Restock | 24 | 1,024.00 |
| 103 | 2026-10-17 | Count fix | -2 | -12.40 |
| 095 | 2026-10-22 | Return | 3 | 35.50 |
| 118 | 2026-10-30 | Transfer | 0 | (empty) |
Score: 5/5 headers verbatim, 25/25 body values semantically correct (29/30 verbatim — the only difference is the 1,024.00 separator). Structure exactly 5×5. No yellow cells.
Case B — tilted, blurry, low-resolution Chinese photo: still exact
This is the case we expected to fail somewhere: 700 px wide, rotated, blurred and compressed to JPEG quality 55, with Chinese product names, the × sign, and unit strings like 1220×2440mm and 240目. It didn't fail — all 20 body values and all 4 headers matched exactly, and the blank stock cell stayed blank. The model left a note: "砂纸库存单元格为空,无法读取" ("the sandpaper stock cell is empty, could not be read") — the honest not-guessing behavior doing its job.
| 品名 | 规格 | 单价(元) | 库存 |
|---|---|---|---|
| 白胶合板 | 1220×2440mm | 58.50 | 120 |
| 不锈钢合页 | 3寸 | 2.80 | 400 |
| 木工胶水 | 500ml | 15.00 | 86 |
| 砂纸 | 240目 | 1.20 | (empty) |
| 防腐木条 | 2m | 9.90 | 45 |
Score: 4/4 headers verbatim, 20/20 body values, structure exactly 4×5 — zero errors and zero fabricated values in this run. A sharper real-world photo should do at least this well — but see the limits section: a worse photo (strong glare, handwriting, very small text) can absolutely still produce errors, and this sample does not prove otherwise.
Case C — merged cells: simplified, but simplified honestly
Merged and nested layouts are the documented weak spot. What we found matches the tool's own limits note, and the model said what it did in the notes:
- Two-level header flattened: "Sales by channel" spanning Online/Retail/Wholesale came back as three columns named
Sales by channel - Online,Sales by channel - Retail,Sales by channel - Wholesale. No information lost, wording changed — 3 of 6 headers differ from the flat truth. - Vertically merged Quarter cells repeated per row: Q1 on all three January–March rows, Q2 on April–June — the documented convention for merged cells, and exactly what the note says happened.
- The blank stayed blank: April's empty Wholesale cell came back empty, not zero.
| Quarter | Month | Sales by channel - Online | Sales by channel - Retail | Sales by channel - Wholesale | Total |
|---|---|---|---|---|---|
| Q1 | Jan | 12,400 | 8,900 | 2,100 | 23,400 |
| Q1 | Feb | 9,800 | 7,600 | 1,900 | 19,300 |
| Q1 | Mar | 14,100 | 9,500 | 2,600 | 26,200 |
| Q2 | Apr | 11,200 | 8,100 | (empty) | 19,300 |
| Q2 | May | 10,700 | 7,900 | 2,300 | 20,900 |
| Q2 | Jun | 12,900 | 8,400 | 2,700 | 24,000 |
Score: 36/36 body values semantically correct, structure 6 columns × 6 rows as in the image. One quirk to disclose: the notes came back in Polish even though we selected "Same as the image" and the table is English — the content was accurate ("Wholesale for Apr is empty in the original; merged Quarter values Q1/Q2 repeated in each row"), but the language choice shows notes are model-generated and not fully predictable. Treat notes as advisory text; the grid itself was correct.
Overall score, with denominators
| Case | Image | Cells (header + body) | Body values correct | Value errors | Invented in blanks |
|---|---|---|---|---|---|
| A | Clean screenshot | 5 + 25 | 25/25 | 0 | 0 |
| B | Tilted low-res photo (Chinese) | 4 + 20 | 20/20 | 0 | 0 |
| C | Merged cells + blanks | 6 + 36 | 36/36 | 0 | 0 |
The export trap: CSV vs XLSX
The grid in the browser is text and always matches the image. The danger lives in the XLSX export's type conversion: values that look like plain numbers are stored as numbers, and number storage drops decoration. We downloaded both formats for every case and read the actual file bytes:
| Cell as shown | CSV gives | XLSX gives | Why |
|---|---|---|---|
| 007 | 007 (text) | 7 (number) | plain digits become a number — leading zeros are gone |
| -87.60 | -87.60 | -87.6 | trailing zeros are not kept in number storage |
| 1,024.00 | 1,024.00 | 1024 | thousands separators are stripped before typing |
| 58.50 | 58.50 | 58.5 | same trailing-zero rule |
| 2026-10-05 | 2026-10-05 | 2026-10-05 (text) | dates are not plain numbers, so they stay text |
| 白胶合板 / Quarter | text | text | non-numeric values stay text |
| (empty cell) | (empty) | (empty) | blanks export as blanks |
CSV export kept every value exactly as displayed: UTF-8 with a BOM (so Excel opens Chinese correctly), CRLF line endings and standard quoting, matching RFC 4180. So the rule is simple: numbers you compute with → XLSX is convenient; identifiers, codes and anything with leading/trailing zeros → use CSV, or make the column Text before the values enter Excel — in the From Text/CSV import wizard's column-type step or Power Query, or by pre-formatting the target column as Text before pasting. Changing a cell's format after Excel has parsed 007 into the number 7 cannot bring the zeros back; the only recovery is re-importing from the original CSV or image (Microsoft's import steps are quoted from official documentation in our CSV-in-Excel guide). If your workflow pastes into an existing sheet, the Copy for spreadsheet button keeps the displayed text too.
Limits and failure handling
- One image per task; JPG/PNG/WebP up to 10 MB; downscaled to 2,000 px on the long edge before sending. Tables over 30 columns or 60 rows are truncated and noted — split the image instead.
- Heavily merged or nested layouts come back simplified (repeated values, flattened headers) — Case C shows what that looks like; budget time to re-merge or rename if your sheet needs the original shape.
- Notes (the model's remarks) are advisory and their language is not guaranteed — ours came back in Chinese for the Chinese table and, unexpectedly, in Polish for the English one.
- This tool makes no overall accuracy promise and neither do we: three clean samples passed, but a poor photo can still produce wrong values without any yellow warning — that is why the checklist below exists.
- Each run costs 1 of your 3 site-wide free trials; results are kept for 24 hours server-side and then become unavailable — download what you need.
- If the result grid fails to appear (network hiccup), refresh the tool page: the task result is re-attached from the server without a new charge (verified — our Case B grid came back intact after a page reload).
A 60-second check before you trust any conversion
- Re-compute one total. Add a row of numbers yourself (in Case C, 12,400+8,900+2,100=23,400 ✓). One wrong digit in the source breaks the sum and exposes it.
- Scan the first column. Codes and dates live here; this is where leading zeros and date formats die silently.
- Count blanks. Blank cells in the image should be blank in the grid. An unexpected value where the image shows nothing is a fabrication — delete it.
- Check negatives and decimals. Minus signs and decimal points are exactly the characters OCR drops; compare the columns with the most decimals against the image.
- Decide CSV vs XLSX. Leading zeros or codes → CSV, or set the column to Text at import time (post-hoc format changes cannot restore lost zeros — see the export section). Pure arithmetic columns → XLSX is fine and sorts/sums correctly.
Try it with our samples
These are the exact inputs and expected-value files from the runs above (YYSI-made synthetic material, no third-party content). Download them, run the image-to-table tool yourself, and compare your grid against the truth CSVs — every conclusion on this page came from these files, so you can reproduce or falsify it.
- clean-screenshot.png — Case A input, 5×5 inventory adjustments — Download sample · 127285 bytes
- case-a-truth.csv — Case A expected values — Download sample · 201 bytes
- tilted-photo-lowres.jpg — Case B input, 700 px tilted/blurry Chinese price list — Download sample · 24106 bytes
- case-b-truth.csv — Case B expected values — Download sample · 181 bytes
- merged-cells.png — Case C input, merged headers and quarters — Download sample · 95036 bytes
- case-c-truth.csv — Case C expected values (flat header convention) — Download sample · 220 bytes
Each link shows the byte size and SHA-256, so you can confirm the file you received is the file we tested.
Related reading: if your converted CSV then opens with mojibake in Excel or loses columns, that is an encoding/delimiter problem, not a recognition problem — the CSV cleaner helps with cleanup, and image to text extracts free-form text from images when you do not need table structure.
Sources & verification
- YYSI Image to Table (the tool tested here; limits and controls verified on the live page on the test day) — Sources checked 2026-11-10
- RFC 4180 — CSV line breaks (CRLF) and quoting rules the exporter follows — Sources checked 2026-11-10
Sources checked Every extraction result, byte count and export behavior below comes from YYSI's own runs on 2026-11-10 against the live yysi.com deployment (script versions image-to-table 2b8ead5b1a7d, ai-structured 5b57e7b1e2e9, tools-common 2a07d94791af), in Chromium 152 on Windows 11, using a standard test account's three free site-wide trials — one run per sample, no retries. Input images and truth tables are original synthetic material, published for download. The tool's input caps and privacy statement are the tool page's own documented limits, checked the same day. Three samples cannot establish a general accuracy rate; we only claim what happened in these runs. Corrections of 2026-11-12 (no test data changed): (1) absolutized blanks behavior — "never guesses / will not fabricate" — was reframed as a design goal plus a small-sample observation, keeping the honest-limit disclosures; (2) the earlier advice to fix a column to text in Excel AFTER importing was replaced: Excel's numeric parse of 007 into 7 cannot be undone by re-formatting the cell, so the text column must be set at import time (From Text/CSV wizard, Power Query) or before pasting, with recovery only via re-import — consistent with the encoding guide's real Excel observations.
Read our editorial standards or send corrections to [email protected].